Canton is a layer 1 blockchain built for regulated financial markets, and it has attracted some of the largest institutions in finance. Goldman Sachs runs its GS DAP tokenization platform on Canton, JPMorgan is bringing Kinexys and JPM Coin to the network, Broadridge settles over $8 trillion a month in repo transactions on it, and DTCC and Euroclear co-chair the Canton Foundation.
Privacy is built into the protocol: a transaction is not broadcast to the whole network. Each participant sees only the part of it their parties are entitled to see, which is what makes the network usable for institutions that cannot put their books on a public chain.
Applications on Canton are written in Daml, and most of them run regulated workflows: settlement, repo, tokenized funds. For the teams operating them, a defect is an operational incident with real counterparties on the other side. Understanding quickly and precisely what a transaction did is part of the infrastructure, and until now the tooling for it has lagged behind the rest of the stack.
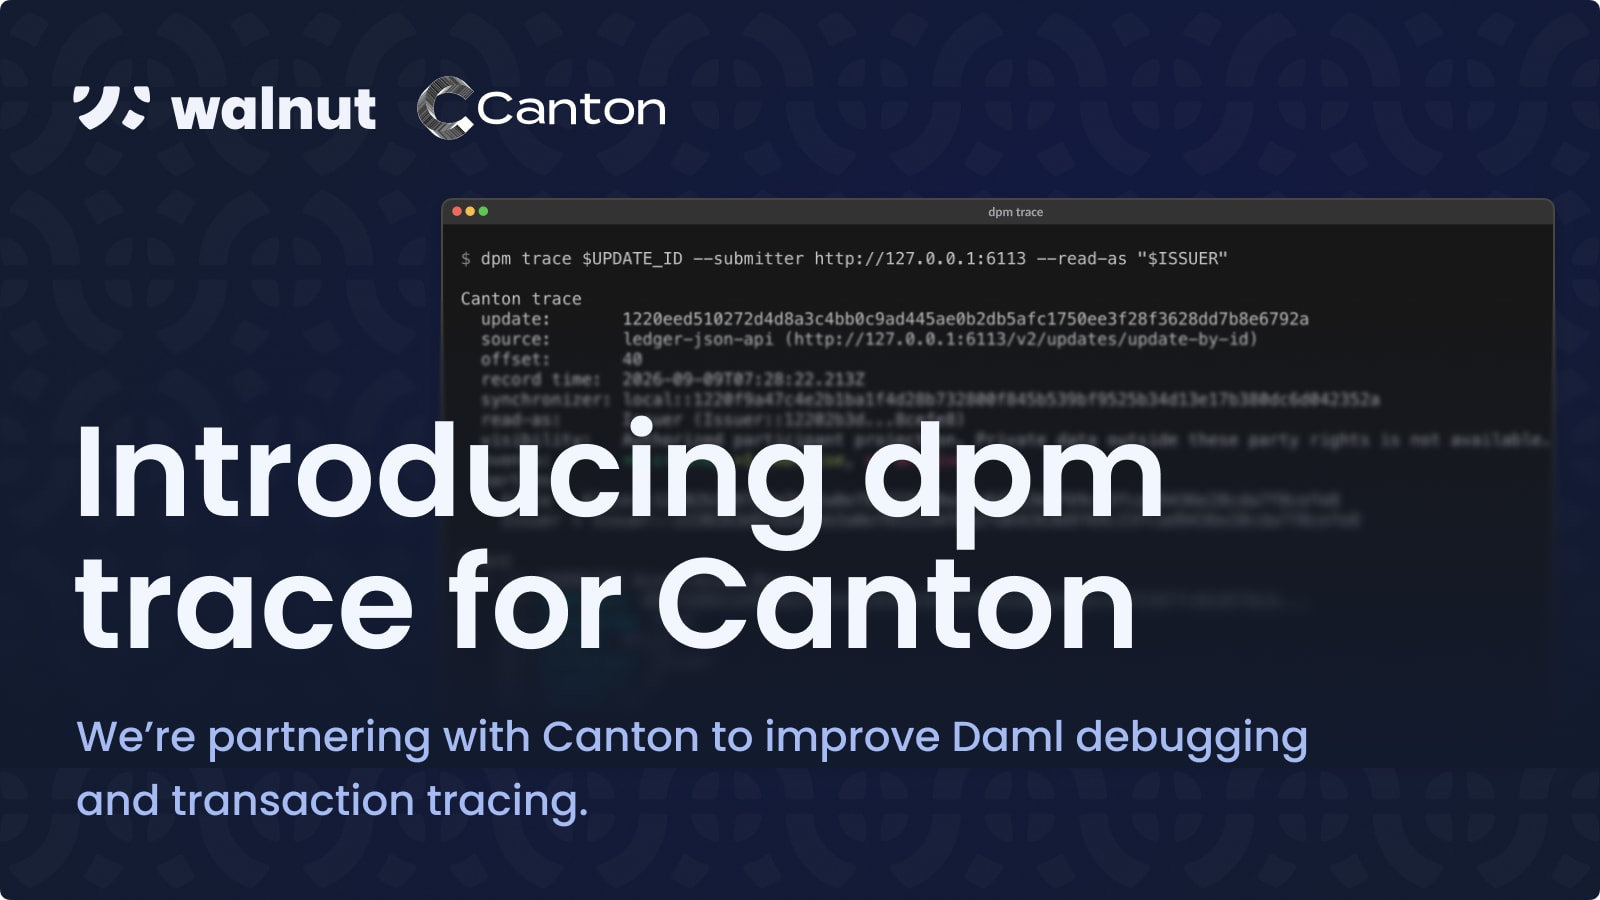
That is the gap our partnership with Canton addresses, and the first release ships today: dpm trace, an open-source transaction debugger for Canton.
Canton developers keep asking for better debugging
We don't have to guess what Canton developers want, because they were asked. In February 2026 the Canton Network community published the Developer Experience and Tooling Survey analysis, based on responses from 41 active developers across the ecosystem.
A visual debugger tops the resulting "Magic Wand" wishlist of high-impact tooling requests. The report notes that:
"Transaction Simulation & Visual Debugging were features developers mentioned as missing or lacking compared to other ecosystems," and multiple respondents named Tenderly as the missing standard. What they asked for was "a visual interface for real-time transaction tracing, failure simulation, and human-readable error decoding to replace the current workflow of parsing cryptic log files."
That last clause is the actual complaint, and it is worth being concrete about what parsing cryptic log files means. Ask a Canton developer how they debug a transaction and you get one of two answers: read the JSON the Ledger API returns, or read the participant logs.
The JSON is a flat list of events. The transaction tree is in there, but you reconstruct it by hand, every time, and the payloads you care about sit nested several levels inside envelopes you don't. The logs are worse. They tell you a transaction happened, not what it did.
That workflow is what Canton brought us in to replace.
Meet dpm trace
dpm trace <update-id> takes the update id Canton returns from a successful submission and prints the transaction as a tree: the choice that was exercised, what it created, what it archived, who signed, and who observed.
The tree is the easy part. The part that takes judgment is what the tree is of, because Canton's privacy model means no participant holds a global record of a transaction. Each participant sees only the sub-transaction its parties are entitled to: its projection. Two participants tracing the same update id will legitimately print different trees, and neither one is wrong or incomplete.
This is where debugging Canton differs from debugging a public chain. A missing event has two possible causes with one symptom: either it never happened, or the party you are reading as is not entitled to see it. Distinguishing the two requires knowing exactly whose view you are looking at.
dpm trace therefore never pretends to show a global record. Every trace names the parties it read as and states the scope of what it can show:
read-as:      Issuer (Issuer::122036f5...7213a4)
visibility:   Authorized participant projection. Private data outside these party rights is not available.
dpm trace ships as a component of dpm, Digital Asset's package manager for Canton, so it runs as dpm trace next to dpm build and dpm sandbox, inside the toolchain Canton developers already use. The binary is self-contained, and the code is open source under Apache 2.0.
Commands and entry points
A debugging question doesn't always start from a committed transaction. A submission may have failed before it produced an update id, or you may want to know what a command would do before sending it. dpm trace covers each case with its own entry point.
The basic call reads a committed update from a participant:
dpm trace <update-id> \
  --submitter http://localhost:7575 \
  --read-as 'Alice::1220...'
Beyond that:
dpm trace --command-id <id>finds a submission that failed and never got an update id, by searching completions.dpm trace --completion-file <file>reads a captured failure with no ledger connection at all.dpm trace preparecomputes what a command would do without committing it.dpm trace submitcommits one and prints the resulting update id.dpm trace comparediffs two transactions, or a prepared command against what actually committed, and names every field that moved.dpm trace --export <file>writes the trace as a portable JSON artifact for downstream tools.dpm trace open <artifact>renders a saved artifact offline.- With a local DAR or
daml.yaml, it maps failures back to Daml source. --visualizeopens an interactive session over the tree.
Working example
Here is what that looks like in practice. Both traces below come from the example asset package shipped in the repository, and both read as the issuer party, but they are two different transactions: the first exercises Withdraw on an asset, the second exercises Split.
Tracing a transaction
Execution tracing reconstructs what the transaction did: every choice exercised, every contract created or archived, and which event caused which. This command reads the committed update from a local participant:
dpm trace 12209edc42ddf07f13bc2c83fef899419901c20094cdd91f511ce98dc1a1c44b4042 \
  --submitter http://127.0.0.1:6113 --read-as $ISSUER
The output opens with the header naming the party read as and the scope of the view, then prints the tree: the exercised choice at the root, the contract it created nested beneath it, and the signatories and observers on each event. Everything the flat JSON makes you reconstruct by hand is already in place.

Interactive visualizer
--visualize opens a session over the trace instead of printing it: step through events, fold subtrees, filter by template, choice, party or contract id, and expand payloads only where you need them. It runs in the terminal, next to the ledger you are already talking to, and nothing is uploaded, which is the right default for a participant's private projection. This session renders a saved trace artifact, so it needs no ledger connection:
dpm trace open examples/exercise-child-create.trace.json --visualizeThe session below moves down the tree event by event, opens each create to read its payload, and collapses the subtree again to get back to the shape of the whole thing.
About Walnut
Walnut builds debuggers and the compiler infrastructure they depend on. We build debug info generation in solc, the official Solidity compiler, in partnership with the Ethereum Foundation and Argot Collective. We build the Walnut debugger for Starknet with StarkWare, and StylusDB, the official debugger for Arbitrum Stylus, with Offchain Labs. Canton is the latest ecosystem where a protocol team has brought us in to build its debugging stack.
Try it now
dpm trace v0.1.3 is available on GitHub. Download the binary, run it against your own transactions, and register it as a dpm component with ./dpm-trace install-plugin. The repository ships captured trace artifacts in examples/, so you can inspect real output with no ledger and no Daml toolchain installed.
If you build a framework, an IDE extension, or an observability product for Canton and want to integrate the trace artifact, reach out. Feedback from the community shapes what we prioritize.
What's next
dpm trace is the first deliverable of this partnership, and the roadmap behind it runs longer than one tool.
The long-term shape is a shared debugging core for Canton. Every product that touches transactions today, including wallets, explorers, and observability platforms, rebuilds tracing and decoding privately, which is parallel effort with no shared benefit. The documented trace artifact and a portable debug info format give each of those layers one core to build on, so the machinery underneath gets one consolidated investment instead of many.
The survey's top request was a visual debugger, and the trace artifact is the foundation for one: the same tree that renders in a terminal can render in a browser, an IDE extension, or an explorer's transaction view. We are working with Canton on those layers next, along with deeper source mapping from runtime failures back to Daml code. More on specific integrations as they ship.
If your team needs help with debugging or compiler infrastructure — on Canton or any other stack — get in touch.