Ever looked at a Starknet transaction and wondered why it cost what it did? The answer lies in how gas is calculated across L2 execution, L1 data and L1 gas usage. In this post, we break down the L2 gas component — and introduce a new Flamegraph tool in Walnut that lets you visualize exactly where your transaction spent gas, down to each contract and Cairo function call.
Every Starknet transaction incurs fees that come from three different gas components:
- L2 gas – measures computation, code complexity and data usage on Starknet (L2).
- L1 data gas – covers the cost of posting the transaction's state diff (e.g., storage changes or class declarations) to L1 for data availability.
- L1 gas fee – applies when sending messages from L2 to L1, or when calldata (instead of blobs) is used for data availability.
The transaction's actual fee (the fee users see in their wallet) is calculated from these three components. It is computed as a weighted sum of the components multiplied by their respective gas prices. Gas prices (L1 gas price, L1 data gas price, and L2 gas price) are determined by the sequencer at block production time. These prices reflect the current cost of using L1 and L2 resources and are embedded in the block context. For more details, see the Starknet fee mechanism documentation.
In this post we will break down how L2 gas is calculated on Starknet, using a real transaction to illustrate how execution and data resources contribute to cost. We also introduce a brand new Flamegraph visualisation tool in Walnut that helps Cairo developers analyze Starknet transaction costs on a granular level – making it easy to see exactly where gas is spent.
Analysing L2 gas cost of a sample transaction using Walnut Call Trace with Gas Information
We'll use the following transaction 0x30e60f2bf9dd5ae90a642fcca957883a8f517549c0f69fd9c0decaa0b7ca54b as our running example, you can check it at walnut.dev.
The prerequisites for getting per-call gas breakdown on Cairo contracts on Walnut are:
- Transaction Version 3
- Sierra Contract Version: ≥ 1.7.0
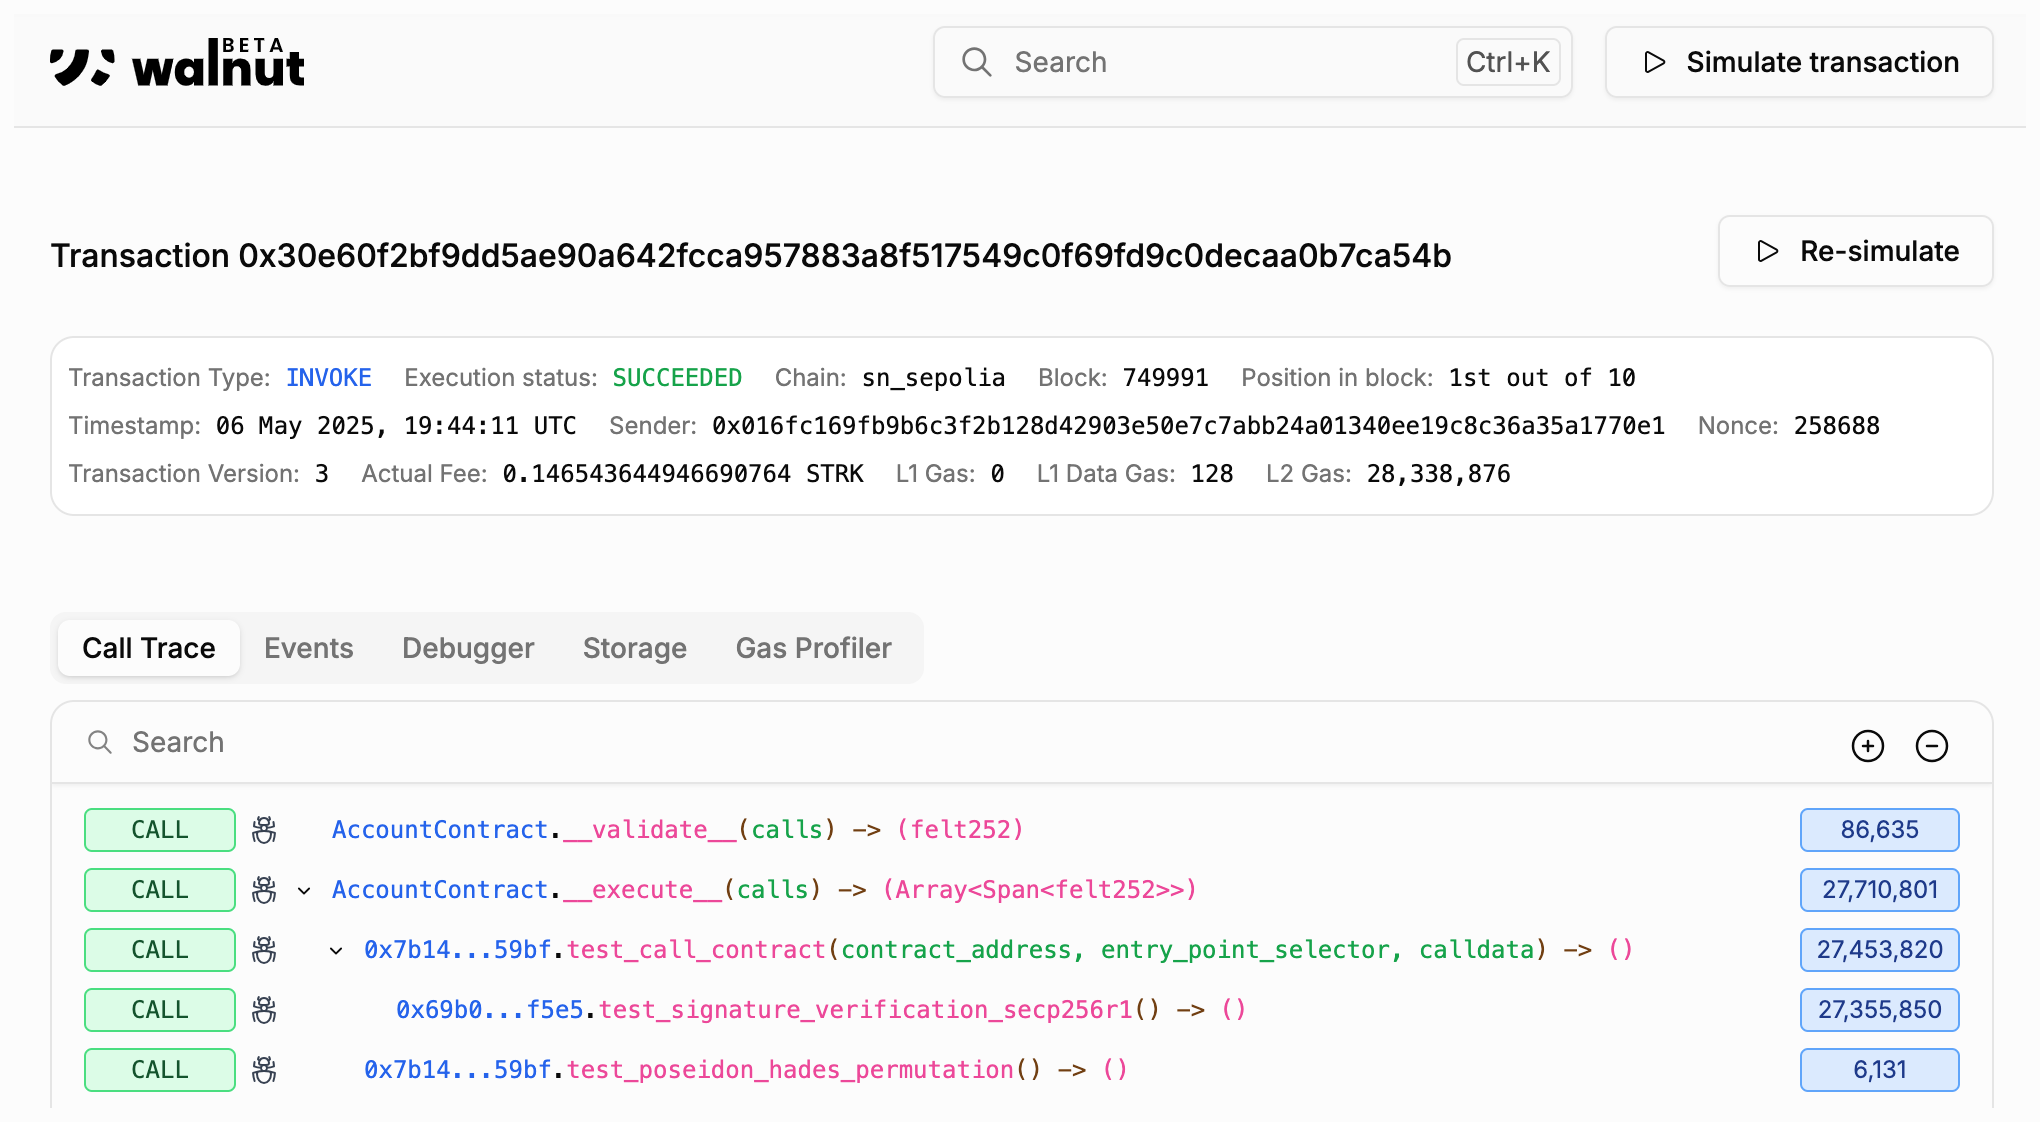
The image above shows a full Call Trace on Walnut with enhanced Gas Information. It involves a few contract calls, each with its own gas cost visualised in the blue chip on the right:
AccountContract.__validate__: 86,635 L2 GasAccountContract.__execute__: 27,435,820 L2 Gas0x7b14d2b859efbbc97d68ca769d6e9b6a1c1fd9629d213e8555335448dc759bf.test_call_contract: 27,710,801 L2 Gas0x69b0b8db5469b82390505d02cda4ca08bebf50ca0d824a88b6756fcd5aaf5e5.test_signature_verification_secp256r1: 27,355,850 L2 Gas0x7b14d2b859efbbc97d68ca769d6e9b6a1c1fd9629d213e8555335448dc759bf.test_poseidon_hades_permutation: 6,131 L2 Gas
This detailed breakdown of gas usage helps you understand, on a granular level, the gas cost per contract and function calls in your Starknet transactions.
Introducing Flamecharts for Cairo Transactions
To provide a more visual representation of where the majority of gas is spent, we are introducing Flamecharts for Cairo transactions. They are a great way to understand the gas usage of a transaction and to identify the most expensive parts of the transaction.
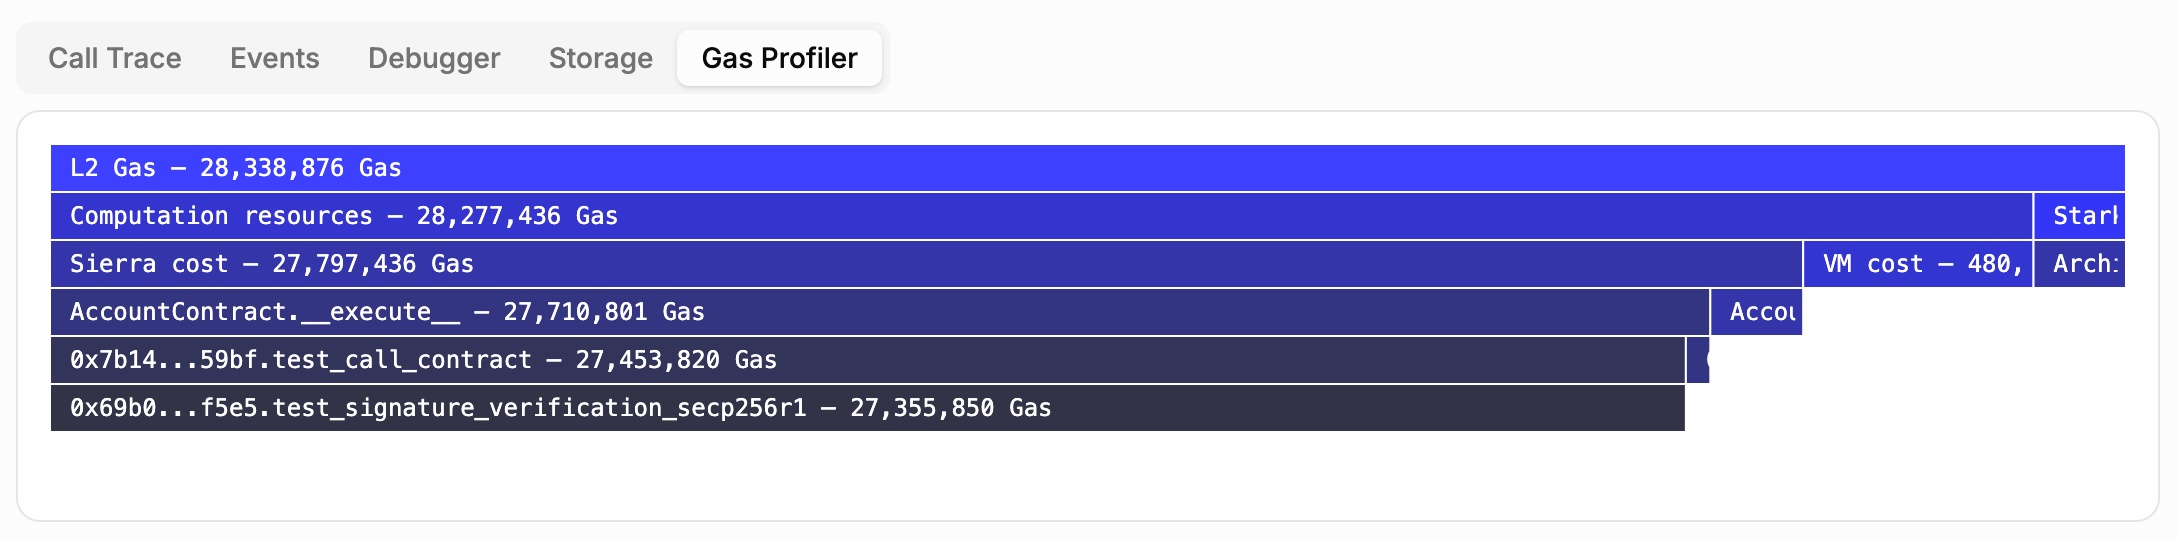
test_signature_verification_secp256r1 function call.The image above presents the gas Flamechart for our transaction. The root frame represents the total L2 Gas of the transaction and it is then divided into two main parts:
-
Computation Resources: Actual Cairo (or more specifically Sierra) execution cost. In most cases, this is where the majority of L2 gas goes and where optimization efforts should be focused on. Computation resources are further divided into two sub-components:
- VM cost: Measures how many VM steps were executed together with the usage of builtins e.g.
range_check,pedersen,poseidon, etc. - Sierra cost: Tracks the logical structure and complexity of the code. The gas cost is calculated by summing the cost of each Sierra libfunc (libfuncs are similar to opcodes in the EVM, e.g.
u8_addis a libfunc).- Each frame under
AccountContract.__execute__represents a contract call execution and its children — internal calls made by that contract.
- Each frame under
- VM cost: Measures how many VM steps were executed together with the usage of builtins e.g.
-
Starknet resources: Starknet system-level overhead:
- Archival resources: Cost of storing calldata, signatures, declared class code, and emitted events on L2.
- Messages resources: Gas usage for processing L1 ↔ L2 messages (e.g.,
send_message_to_l1). - State resources: Cost of storage writes, class hash updates, compiled class updates, and contract deployments. Also, number of new storage keys allocated in the transaction.
The below structure is a visual representation of all the key resources the Flamegraph shows, helping you trace gas usage from top-level categories to specific calls.
L2 Gas
└── Computation resources
    ├── VM cost
    └── Sierra cost
        ├── __validate__
        └── __execute__
            ├── test_call_contract
            │   └── test_signature_verification_secp256r1
            └── test_poseidon_hades_permutation
└── Starknet resources
    ├── Archival resources
    ├── Messages resources
    └── State resources
Cheat Sheet for Optimizing Cairo Transactions Gas Usage
Once you understand which part of the transaction consumes what, you can target your optimizations more effectively. Here's a quick cheat sheet on what to watch out for, and how to reduce the impact of each component:
| Total Gas Component | How to Optimize? |
|---|---|
| Computation Resources > VM Cost | Simplify logic, avoid expensive builtins like ec_op, keccak, ECDSA. |
| Computation Resources > Sierra cost | Refactor your Cairo code to use cheaper Sierra libfuncs, reduce intermediate variables and duplicated operations. |
| Starknet Resources > Archival resources | Minimize calldata size, use compact types (felt252), reduce event emissions. |
| Starknet Resources > Messages resources | Avoid unnecessary L1 ↔ L2 messages, batch and pack data before sending. |
| Starknet Resources > State resources | Reduce storage_write, avoid redundant updates. Reuse existing keys when possible; batch updates to same slot. |
💡 Pro tip: Use cairovm.codes to quickly check the Sierra code generated for a given Cairo program.
In the upcoming posts, we'll dive deeper into each gas component with hands-on tips for optimizing your contracts more effectively.
Summary
In this post, we focused on one important part of Starknet Transaction Gas Analysis—the L2 gas. We explained different components of it and presented Walnut's new feature that helps you analyse how your Starknet Application consumes those resources on a granular level.
Understanding where gas costs come from can help you:
- Optimize calldata and minimize unnecessary storage writes.
- Profile inefficient execution paths.
- And most importantly: understand why your transaction cost what it did.
With 🖤 by Walnut